Median is a mathematical statistic. Structural Characteristics of the Variational Distribution Series
Median Me they call such a value of the feature that falls in the middle of the ranked series and divides it into two parts equal in number of units. Thus, in the ranked distribution series, one half of the series has feature values that exceed the median, while the other half has values less than the median.
The median is used instead of the arithmetic mean when the extreme variants of the ranked series (smallest and largest) in comparison with the rest turn out to be excessively large or excessively small.
IN discrete in a variational series containing an odd number of units, the median is equal to the feature variant with the number :
,
where N is the number of population units.
In a discrete series consisting of an even number of population units, the median is defined as the average of the options with numbers and :  .
.
In the distribution of workers by length of service, the median is equal to the average of the options that have numbers 10: 2 = 5 and 10: 2 + 1 = 6 in the ranked series. The options for the fifth and sixth feature are 4 years, thus ![]() of the year
of the year
When calculating the median in interval row first find median interval, (i.e. containing the median), for which the accumulated frequencies or frequencies are used. The median is the interval whose cumulative frequency is equal to or greater than half of the total population. The median value is then calculated using the formula:  ,
,
where is the lower limit of the median interval;
is the width of the median interval;
is the cumulative frequency of the interval preceding the median;
is the frequency of the median interval.
Let us calculate the median of the series of distribution of workers by salary (see the lecture "Summary and grouping of statistical data").
The median wage interval is UAH 800-900, since its cumulative frequency is 17, which is more than half the sum of all frequencies (). Then
Me=800+100 UAH.
The obtained value indicates that half of the workers have wages below UAH 875, but this is higher than its average size.
To determine the median, you can use cumulative frequencies instead of cumulative frequencies.
The median, like the mode, does not depend on the extreme values of the variant, therefore it is also used to characterize the center in distribution series with indefinite boundaries.
median property
: the sum of the absolute values of the deviations of the variant from the median is less than from any other value (including the arithmetic mean): ![]()
This property of the median is used in transport when designing the location of tram and trolleybus stops, gas stations, assembly points, etc.
Example. There are 10 garages on a 100 km long highway. To design the construction of a gas station, data was collected on the number of expected gas station trips for each garage.
Table 2 - Data on the number of trips to gas stations for each garage.
It is necessary to put a gas station so that the total mileage of cars for refueling is the least.
Option 1. If the gas station is placed in the middle of the highway, i.e., at the 50th kilometer (the center of the range of change of the sign), then the runs, taking into account the number of riders, will be:
a) in one direction:
;
b) in the opposite way:
;
c) total mileage in both directions: .
Option 2. If the gas station is placed on the average section of the highway, determined by the arithmetic mean formula, taking into account the number of riders:
The median can be determined graphically, by cumulate (see the lecture "Summary and grouping of statistical data"). For this, the last ordinate, equal to the sum all frequencies or frequencies are divided in half. From the obtained point, the perpendicular is restored to the intersection with the cumulate. The abscissa of the intersection point gives the value of the median.
TEST
On the topic: "Mode. Median. Methods for calculating them"
Introduction
Mean values and related indicators of variation play a very important role in statistics, which is due to the subject of its study. Therefore, this topic is one of the central in the course.
The average is a very common generalizing indicator in statistics. This is explained by the fact that only with the help of the average it is possible to characterize the population according to a quantitatively varying attribute. Average value in statistics, a generalizing characteristic of a set of similar phenomena according to some quantitatively varying characteristic is called. The average shows the level of this attribute, related to the unit of the population.
Studying social phenomena and seeking to identify their characteristic, typical features in specific conditions of place and time, statisticians make extensive use of average values. With the help of averages, different populations can be compared with each other according to varying characteristics.
Averages used in statistics belong to the class of power averages. Of the power averages, the arithmetic mean is most often used, less often the harmonic mean; the harmonic mean is used only when calculating the average rates of dynamics, and the mean square - only when calculating the variation indicators.
The arithmetic mean is the quotient of dividing the sum of the options by their number. It is used in cases where the volume of a variable attribute for the entire population is formed as the sum of the attribute values for its individual units. The arithmetic mean is the most common type of average, since it corresponds to the nature of social phenomena, where the volume of varying signs in the aggregate is most often formed precisely as the sum of the values of the attribute in individual units of the population.
According to its defining property, the harmonic mean should be used when the total volume of the attribute is formed as the sum of the reciprocal values of the variant. It is used when, depending on the material available, the weights do not have to be multiplied, but divided into options or, what is the same, multiplied by their inverse value. The harmonic mean in these cases is the reciprocal of the arithmetic mean of the reciprocal values of the attribute.
The harmonic mean should be used in cases where the weights are not the units of the population - the carriers of the feature, but the products of these units and the value of the feature.
1. Definition of mode and median in statistics
The arithmetic and harmonic means are the generalizing characteristics of the population according to one or another varying attribute. Auxiliary descriptive characteristics of the distribution of a variable attribute are the mode and the median.
In statistics, fashion is the value of a feature (variant) that is most often found in a given population. In the variation series, this will be the variant with the highest frequency.
The median in statistics is called the option, which is in the middle variation series. The median divides the series in half, on both sides of it (up and down) there is the same number of population units.
Mode and median, in contrast to the exponential averages, are specific characteristics, their value is any particular variant in the variation series.
Mode is used in cases where it is necessary to characterize the most frequently occurring value of a feature. If it is necessary, for example, to find out the most common wage in the enterprise, the market price at which the largest number of goods were sold, the size of shoes that are most in demand among consumers, etc., in these cases resort to fashion.
The median is interesting in that it shows the quantitative limit of the value of the variable characteristic, which was reached by half of the members of the population. Let the average salary of bank employees amount to 650,000 rubles. per month. This characteristic can be supplemented if we say that half of the workers received a salary of 700,000 rubles. and higher, i.e. let's take the median. The mode and median are typical characteristics in cases where the populations are homogeneous and large in number.
2. Finding the Mode and Median in a Discrete Variation Series
Finding the mode and median in a variational series, where the attribute values are given by certain numbers, is not very difficult. Consider table 1. with the distribution of families by the number of children.
Table 1. Distribution of families by number of children
Obviously, in this example, the fashion will be a family with two children, since this value of options corresponds to largest number families. There may be distributions where all variants are equally frequent, in which case there is no fashion, or, in other words, all variants can be said to be equally modal. In other cases, not one, but two options may be the highest frequency. Then there will be two modes, the distribution will be bimodal. Bimodal distributions may indicate the qualitative heterogeneity of the population according to the trait under study.
To find the median in a discrete variation series, you need to divide the sum of frequencies in half and add ½ to the result. So, in the distribution of 185 families by the number of children, the median will be: 185/2 + ½ = 93, i.e. The 93rd option, which divides the ordered row in half. What is the meaning of the 93rd option? In order to find out, you need to accumulate frequencies, starting from the smallest options. The sum of the frequencies of the 1st and 2nd option is 40. It is clear that there are no 93 options here. If we add the frequency of the 3rd option to 40, then we get the sum equal to 40 + 75 = 115. Therefore, the 93rd option corresponds to the third value of the variable attribute, and the median will be a family with two children.
Mode and median in this example coincided. If we had an even sum of frequencies (for example, 184), then applying the above formula, we get the number of the median options, 184/2 + ½ = 92.5. Since there are no fractional options, the result indicates that the median is in the middle between 92 and 93 options.
3. Calculation of the mode and median in the interval variation series
The descriptive nature of the mode and median is due to the fact that they do not compensate for individual deviations. They always correspond to a certain variant. Therefore, the mode and median do not require calculations to find them if all the values of the attribute are known. However, in the interval variation series, calculations are used to find the approximate value of the mode and median within a certain interval.
To calculate a certain value of the modal value of a sign enclosed in an interval, the following formula is used:
M o \u003d X Mo + i Mo * (f Mo - f Mo-1) / ((f Mo - f Mo-1) + (f Mo - f Mo + 1)),
Where X Mo is the minimum limit of the modal interval;
i Mo is the value of the modal interval;
fMo is the frequency of the modal interval;
f Mo-1 - the frequency of the interval preceding the modal;
f Mo+1 is the frequency of the interval following the modal.
We will show the calculation of the mode using the example given in Table 2.
Table 2. Distribution of workers of the enterprise according to the implementation of production standards
To find the mode, we first determine the modal interval of the given series. It can be seen from the example that the highest frequency corresponds to the interval where the variant lies in the range from 100 to 105. This is the modal interval. The value of the modal interval is 5.
Substituting the numerical values from table 2. into the above formula, we get:
M o \u003d 100 + 5 * (104 -12) / ((104 - 12) + (104 - 98)) \u003d 108.8
The meaning of this formula is as follows: the value of that part of the modal interval, which must be added to its minimum boundary, is determined depending on the magnitude of the frequencies of the previous and subsequent intervals. IN this case we add 8.8 to 100, i.e. more than half of the interval, because the frequency of the previous interval is less than the frequency of the subsequent interval.
Let's calculate the median now. To find the median in the interval variation series, we first determine the interval in which it is located (the median interval). Such an interval will be one whose cumulative frequency is equal to or greater than half the sum of the frequencies. Cumulative frequencies are formed by gradual summation of frequencies, starting from the interval with the smallest feature value. Half the sum of the frequencies we have is 250 (500:2). Therefore, according to table 3. the median interval will be the interval with the value of wages from 350,000 rubles. up to 400,000 rubles.
Table 3. Calculation of the median in the interval variation series
Before this interval, the sum of the accumulated frequencies was 160. Therefore, in order to obtain the value of the median, it is necessary to add another 90 units (250 - 160).
Mode and median- a special kind of averages that are used to study the structure of the variation series. They are sometimes called structural averages, in contrast to the previously discussed power-law averages.
Fashion- this is the value of the attribute (variant), which is most often found in this population, i.e. has the highest frequency.
Fashion has a great practical application, and in some cases only fashion can characterize social phenomena.
Median is the variant that is in the middle of the ordered variation series.
The median shows the quantitative limit of the value of the variable characteristic, which is reached by half of the population units. The use of the median along with the average or instead of it is advisable if there are open intervals in the variation series, because the calculation of the median does not require the conditional establishment of the boundaries of open intervals, and therefore the absence of information about them does not affect the accuracy of the calculation of the median.
The median is also used when the indicators to be used as weights are unknown. The median is used instead of the arithmetic mean in statistical methods of product quality control. The sum of absolute deviations of options from the median is less than from any other number.
Consider the calculation of the mode and median in a discrete variational series :
Determine the mode and median.
Fashion Mo = 4 years, since this value corresponds to the highest frequency f = 5.
Those. Most of the workers have 4 years of experience.
In order to calculate the median, we first find half the sum of the frequencies. If the sum of the frequencies is an odd number, then we first add one to this sum, and then divide it in half:
The median will be the eighth option.
In order to find which option will be the eighth in number, we will accumulate frequencies until we get the sum of frequencies equal to or greater than half the sum of all frequencies. The corresponding option will be the median.
Me = 4 years.
Those. half of the workers have less than four years of experience, half more.
If the sum of the accumulated frequencies against one option is equal to half the sum of the frequencies, then the median is defined as the arithmetic average of this option and the next one.
Calculation of the mode and median in an interval variation series
The mode in the interval variation series is calculated by the formula
![]()
Where X М0- initial border of the modal interval,
hm 0 is the value of the modal interval,
fm 0 , fm 0-1 , fm 0+1 - the frequency of the modal interval, respectively, preceding the modal and subsequent.
Modal The interval with the highest frequency is called.
Example 1
|
Groups by experience |
Number of workers, people |
Accumulated Frequencies |
Determine the mode and median.
Modal interval, because it corresponds to the highest frequency f = 35. Then:
Hm 0 =6, fm 0 =35
The MEDIAN function in Excel is used to analyze a range of numeric values and returns a number that is the middle of the set under study (median). That is, this function conditionally divides the set of numbers into two subsets, the first of which contains numbers less than the median, and the second - more. The median is one of several methods for determining the central trend of a range under study.
Examples of using the MEDIAN function in Excel
When studying the age groups of students, data from a randomly selected group of students in the university were used. The task is to determine the median age of students.
Initial data:
Formula for calculation:
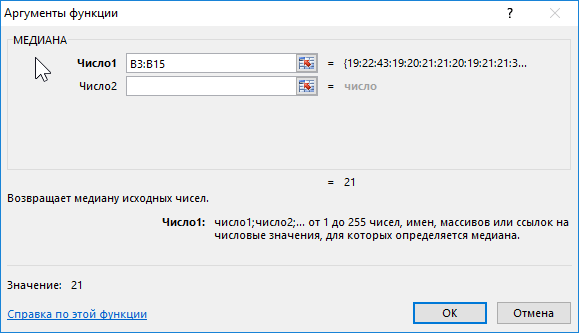
Argument description:
- B3:B15 - the range of the studied ages.
Result:
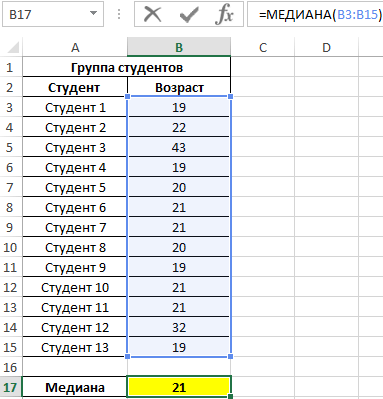
That is, there are students in the group whose age is less than 21 years and more than this value.
Comparing the MEDIAN and AVERAGE functions to calculate the average value
During the evening round in the hospital, each patient's body temperature was measured. Demonstrate the feasibility of using the median parameter instead of the mean value to explore a series of obtained values.
Initial data:
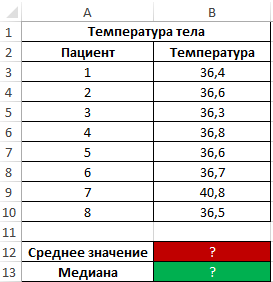
Formula for finding the average value:

Formula for finding the median:

As can be seen from the average value, the average temperature in patients is above normal, but this is not true. The median shows that at least half of the patients have a normal body temperature, not exceeding 36.6.
Attention! Another method for determining the central trend is the mode (the most common value in the range under study). To determine the central trend in Excel, use the FASHION function. Note that in this example, the median and mode values are the same:

That is, the median value that divides one set into subsets of smaller and larger values is also the most frequently occurring value in the set. As you can see, most patients have a temperature of 36.6.
An example of calculating the median in statistical analysis in Excel
Example 3. There are 3 salespeople working in a store. Based on the results of the last 10 days, it is necessary to determine the employee to whom the bonus will be issued. When choosing the best worker, the degree of efficiency of his work is taken into account, and not the number of goods sold.
Source data table:

To characterize the efficiency, we will use three indicators at once: the mean value, the median, and the mode. Let's define them for each employee using the AVERAGE, MEDIAN and FASHION formulas, respectively:

To determine the degree of data scatter, we use a value that is the total value of the modulus of the difference between the mean value and the mode, the mean value and the median, respectively. That is, the coefficient x=|av-med|+|av-mod|, where:
- av – mean value;
- med is the median;
- mod - fashion.
Calculate the value of the coefficient x for the first seller:
Similarly, we will carry out calculations for other sellers. Results:

Let's define the seller to whom the bonus will be given:
Note: The SMALL function returns the first minimum value from the considered range of x-factor values.

The coefficient x is some quantitative characteristic of the stability of the work of sellers, which was introduced by the store economist. With its help, it was possible to determine the range with the smallest deviations of values. This method demonstrates how three methods of determining the central trend can be used at once to obtain the most reliable results.
Features of using the MEDIAN function in Excel
The function has the following syntax:
MEDIAN(number1, [number2],...)
Description of arguments:
- number1 is a mandatory argument that characterizes the first numeric value contained in the range under study;
- [number2] – optional second (and subsequent arguments, up to 255 arguments in total) characterizing the second and subsequent values of the range under study.
Notes 1:
- When calculating, it is more convenient to transfer the entire range of the studied values at once instead of entering the arguments sequentially.
- Arguments are numeric data, names containing numbers, reference data, and arrays (for example, =MEDIAN((1;2;3;5;7;10))).
- When calculating the median, cells containing empty values or logical TRUE, FALSE are taken into account, which will be interpreted as numeric values 1 and 0, respectively. For example, the result of executing a function with logical values in the arguments (TRUE; FALSE) is equivalent to the result of executing with arguments (1; 0) and is equal to 0.5.
- If one or more function arguments take text values that cannot be converted to numeric values, or contain error codes, the function will return the #VALUE! error code.
- Other Excel functions can be used to determine the median of the sample: PERCENTILE.INC, QUARTILE.INC, GREAT Examples of use:
- =PERCENTILE.ON(A1:A10,0.5) because by definition the median is the 50th percentile.
- =QUARTILE.ON(A1:A10,2) because the median is the 2nd quartile.
- =LARGE(A1:A9;COUNT(A1:A9)/2), but only if the number of numbers in the range is an odd number.
Notes 2:
- If all numbers in the range under study are distributed symmetrically about the mean, the arithmetic mean and median for this range will be equivalent.
- With large data deviations in the range (“scatter” of values), the median better reflects the trend in the distribution of values than the arithmetic mean. An excellent example is the use of the median to determine the real level of salaries of the population of a state in which officials receive an order of magnitude more than ordinary citizens.
- The range of investigated values may contain:
- Odd number of numbers. In this case, the median will be a single number dividing the range into two subsets of larger and smaller values, respectively;
- An even number of numbers. Then the median is calculated as the arithmetic mean of two numeric values dividing the set into the two subsets indicated above.
To calculate the median in MS EXCEL there is a special function MEDIAN() . In this article, we will define the median and learn how to calculate it for a sample and for a given distribution law random variable.
Let's start with medians For samples(i.e. for a fixed set of values).
Sample median
Median(median) is the number that is the middle of the set of numbers: half of the numbers in the set are greater than median, and half of the numbers are less than median.
To calculate medians needed first (values in sampling). For example, median for sample (2; 3; 3; 4 ; 5; 7; 10) will be 4. Since. only in sampling 7 values, three of them less than 4 (i.e. 2; 3; 3) and three values greater than (i.e. 5; 7; 10).
If the set contains an even number of numbers, then it is calculated for two numbers in the middle of the set. For example, median for sample (2; 3; 3 ; 6 ; 7; 10) will be 4.5, because (3+6)/2=4.5.
For determining medians in MS EXCEL there is a MEDIAN() function of the same name, English version MEDIAN().
Median does not necessarily match . A match occurs only if the values in the sample are distributed symmetrically about middle. For example, for samples (1; 2; 3 ; 4 ; 5; 6) median And average are equal to 3.5.
If known distribution function F(x) or probability density function p(X), That median can be found from the equation:

For example, by solving this equation analytically for the Lognormal distribution lnN(μ; σ 2), we obtain that median is calculated by the formula =EXP(μ). For μ=0, the median is 1.

Pay attention to the dot Distribution functions, for which F(x)=0.5(see picture above) . The abscissa of this point is 1. This is the value of the median, which naturally coincides with the previously calculated value using the em formula.
in MS EXCEL median For lognormal distribution LnN(0;1) can be calculated using the formula =LOGNORM.INV(0,5,0,1).
Note: Recall that the integral of over the entire area of setting a random variable is equal to one.

Therefore, the median line (x=Median) divides the area under the graph probability density functions into two equal parts.
