Practical lesson "calculation of derivatives". Practical lesson "calculating derivatives" Find the derivative of the function y
Lesson objectives:
Educational- know differentiation formulas; differentiation rules;
differentiation of a complex function; physical and geometric meaning of derivative;
equation of the tangent to the graph of a function.
Developmental - be able to find derivatives of functions; solve problems using physical meaning, geometric meaning; find the value of the derivative of a function at a point; mathematically correctly explain and justify the actions performed.
Educational – cultivate independence, responsibility, reflection.
During the classes
I. Organizational moment.
II. Checking homework
(during breaks, consultants check (students) and assign grades).
III. Goal setting and motivation
The teacher informs students that this lesson is the final lesson on the topic “Calculating derivatives” and invites them to formulate their own goals.
Teacher: “The great philosopher Confucius once said: “Three paths lead to knowledge: the path of reflection is the noblest path, the path of imitation is the easiest path, and the path of experience is the most bitter path.” So today in class, each of you will determine which path to knowledge of this topic he is on.”
Students are given the task of demonstrating their knowledge and skills in calculating derivatives and are given a lesson plan.
Stage I: Completing the task using the “Remember” card.
(testing knowledge of formulas and rules of differentiation).
Stage II: Oral frontal work on repetition and generalization of knowledge.
Stage III:“Test forecast” (when performing this task, the help of consultants is acceptable).
IStage V: Solution of a practical problem.
Stage V: Independent work
Stages I, III, V of work and homework are assessed. Consultants check and enter the results into the evaluation table.
Evaluation criteria: "5"- 19-20 points;
"4"- 15-18 points;
"3"- 10-14 points.
Paths to knowledge
- Reproduction and correction of reference knowledge
Stage I.
Target: control, self-control of knowledge of formulas and rules of differentiation
Remember! F.I. ___________________________________________________ |
|
Derivative |
|
c,c - cons t |
|
|
|
|
|
f"(x)+ g"(x) |
|
f(x)* g(x) |
|
|
|
At the end of this task, a self-test is performed using the “Table of Derivatives”. Cards are handed over to consultants for verification (corrections on cards are not allowed).
V. Generalization and systematization of knowledge
Stage II.
1. Oral frontal work.
A. Generate a task for this condition and solve it.
![]()
1. Find the value of the derivative of the function at the point t = 3. (Answer: 21.)
2. Create an equation for the tangent to the graph of the function at point t = 3. (Answer: y = 21x-45.).
3. Find the speed of the body and acceleration at the moment t=3c, if the law of motion is given by the formula. (Answer: 21 m/s, 16 m/s²).
4. Find the angular coefficient of the tangent drawn to the graph of the function at point t = 3. (Answer: 21.).
5. Find the tangent of the angle of inclination of the tangent to the graph of the function at the point t = 3 and determine the type of angle between the tangent and the positive direction of the Ox axis. (Answer: tgα, angle α is acute)
B. Find derivatives of functions

2. Stage III“Test forecast”


At the end of this task, a self-test is performed based on the final answers and the tests are handed over to consultants. (corrections on cards are not allowed).
Answers:
1 option |
||||
Option 2 |
- The solution of the problem
IStage V
Frontal solution to an advanced level problem (the solution is carried out by consultants together with the class).
Task
At what parameter values a tangents to the graph of a function ![]()
drawn at the points of its intersection with the X axis, form an angle of 60° between themselves?

The graph is a parabola with upward branches intersecting the X axis at two points (the case a=0 does not satisfy the meaning of the problem):
IX. Summing up and grading
1. Questions: a) Has the purpose of the lesson been achieved?
b) Which stage seemed the most difficult?
c) What was the most interesting?
2. Consultants announce the results (number and names of students on the way
imitation, ways of reflection and ways of experience).
Practical work
mathematics
1. Finding the limit of a function. The first and second are wonderful limits.
2. Derivative of a complex function. Study of a function of one variable and plotting graphs.
3. Test “Application of differential calculus to the study of functions.”
4. Finding indefinite integrals. Calculation of definite integrals.
5. Calculation of determinants.
6. Solving systems of linear equations using the Cramer method. Test.
7. Solving problems on the topic “Sets”. Logic algebra formulas.
8. Calculation of probabilities of random events. Total probability formula.
9. Calculation of numerical characteristics.
10. Test “Fundamentals of probability theory and mathematical statistics”
11. Trigonometric form of a complex number.
12. Actions with complex numbers in various forms.
METHODOLOGICAL INSTRUCTIONS FOR PRACTICAL WORK IN MATHEMATICS
COURSE 2
A practical lesson is a form of organizing the educational process, which involves students performing one or more practical works on assignment and under the guidance of a teacher.
Thus, in practical classes in mathematics, students develop the ability to solve problems, which in the future should be used to solve professional problems in special disciplines.
In the course of practical work, students master the ability to use information sources, work with regulatory documents and instructional materials, reference books, make drawings, diagrams, tables, solve various kinds of problems, and make calculations.
Problems that are solved during practical lessons in mathematics:
1) expansion and consolidation of theoretical knowledge in mathematics acquired during lectures;
2) developing in students the practical skills and abilities necessary to successfully solve problems in mathematics;
3) development of students’ need for self-education and improvement of knowledge and skills in the process of studying mathematics;
4) formation of a creative attitude and research approach in the process of studying mathematics;
5) formation of professionally significant qualities of a future specialist and skills in applying acquired knowledge in the professional field.
Practical lesson No. 1. Calculation of function limits. The first and second are wonderful limits.
Subject : Calculation of function limits.
Target: acquisition of basic knowledge in the field of fundamental branches of mathematics . Testing the assimilation of knowledge on calculating the limits of functions. Repeat and systematize knowledge on this topic.
Tasks:
Development of creative professional thinking;
Mastery of the language of science, skills of operating concepts;
Mastering the skills of setting and solving problems;
Deepening theoretical and practical training;
Development of initiative and independence of students.
Strengthening computing skills;
Continue working on mathematical speech.
Formation of skills for independent work, working with a textbook, skills for independently acquiring knowledge;
Development of the ability to highlight the main thing when working with text;
Formation of independent thinking, mental operations: comparison, analysis, synthesis, generalization, analogy;
Show students the role of systematic work to deepen and increase the strength of knowledge, on the culture of completing tasks;
Development of students' creative abilities.
Providing practical work:
Theoretical material of methodological recommendations for practical work.
Mathematics, – Series: Secondary vocational education. - Rostov-on-Don “Phoenix”, p.
Progress of the practical lesson.
1.Formulation of the topic of the lesson, explanation of the connection of the topic with other topics of the academic discipline;
2.Checking students’ readiness for class;
3. Conducting the actual lesson according to the topic and in accordance with the work program of the discipline:
Study theoretical material on the topic “Calculating the limits of functions.”
Consider examples of solving typical tasks.
Do independent work on calculating the limits of functions using the first and second remarkable limits.
Answer security questions.
Theoretical information and methodological recommendations
on problem solving.
1. Presentation of theoretical material.
To calculate the limit of a function at a point, you need to:
1) Substitute instead of the variable x what x tends to.
2) If after completing step 1) we get an uncertainty of the form https://pandia.ru/text/78/405/images/image003_6.png" width="19" height="22 src=">and replace the arrow with a minus: (x-a).
3) If, after completing step 1), we receive an uncertainty of the form https://pandia.ru/text/78/405/images/image002_13.png" width="18" height="31 src="> associated with the values of trigonometric functions , we must use the first remarkable limit.
Definition. The first remarkable limit is called the limit
https://pandia.ru/text/78/405/images/image007_4.png" alt="$\displaystyle \lim_(x\to0)\dfrac(\sin x)(x)=1. $" width="102" height="52">!}
5) Definition:The second remarkable limit called limit

The number given by this limit plays a very important role both in mathematical analysis and in other branches of mathematics. The number is called base of natural logarithms ( https://pandia.ru/text/78/405/images/image009_4.png" alt="$ e$" width="11" height="14">показывает, что -- иррациональное число, несколько первых десятичных знаков которого таковы:!}
![]()
2. Consolidation of the studied material.
Example 1
https://pandia.ru/text/78/405/images/image015_1.png" width="28" height="30 src=">= -4
We used rule 1) and substituted instead of x what x should strive for, i.e. x=2.
Example 2
https://pandia.ru/text/78/405/images/image017_1.png" width="154" height="32 src=">.png" width="21" height="30 src=">= 5
Example 3
https://pandia.ru/text/78/405/images/image021_1.png" width="199" height="37 src=">.png" width="137" height="35 src=">. png" width="138" height="24 src=">=3+3=6
Example 4
https://pandia.ru/text/78/405/images/image004_7.png" width="22" height="31 src=">.png" width="104" height="46 src=">. png" height="30 src=">
Example 5
https://pandia.ru/text/78/405/images/image032_0.png" width="61" height="46 src=">.png" height="30 src=">=2
Example 6
https://pandia.ru/text/78/405/images/image036_0.png" width="18" height="28 src=">
b) 
V) 
3. Consolidation of knowledge, skills and abilities.
Do independent work on calculating the limits of functions.
Practical work No. 1. Option 1 Calculate the limit of the function: 1. 2. 3. 10. | Practical work No. 1. Option 2 Calculate the limit of the function: 1. 2. 3. 10. |
Practical work No. 2.
Subject : Finding the derivative of a function. Study of a function of one variable and plotting a graph.
Target : Test in practice knowledge of the concept of a derivative of a function, the ability to find derivatives of elementary functions, complex functions, inverse functions, using the table of derivatives and differentiation rules, the concept of a complex and inverse function, the ability to use a derivative to study functions.
Providing practical work:
Textbook. "Mathematics". – M.: Bustard, 2010.
Mathematics. M: Forum-Infa 2008.
Individual cards with a practical work option.
1. Theoretical material and examples of finding the derivative of a function.
Definition: The derivative of the function f(x) (f"(x)) at point x is the limit of the ratio of the increment of the function to the increment of the argument when the increment of the argument tends to zero:
https://pandia.ru/text/78/405/images/image061_0.png" width="209 height=235" height="235">
Rules of differentiation.
If the functions f(x) and g(x) have derivatives, then
2. (u+v)′=u′+v′
3. (uv)′=u′v+v′u
4. (C u)′=C u′, where C=const
5..png" width="49" height="54 src=">
6. Derivative of a complex function:
f′(g(x))=f′(g) g′(x)
2. Examples.
1..png" width="61" height="41 src=">.png" width="20" height="41 src=">.png" width="20" height="41 src="> .png" width="69" height="41 src=">+4).
The function is the product of two factors: u=https://pandia.ru/text/78/405/images/image071_0.png" width="72" height="41 src=">.png" width="64" height="41 src=">.png" width="19" height="41 src=">.png" width="45" height="51 src=">.
The function is the quotient of two expressions: u=https://pandia.ru/text/78/405/images/image079.png" width="52" height="41 src=">..png" width="215" " height="57 src=">.png" width="197 height=36" height="36">
Solution. Let's find the derivative of this function using the rule of differentiation of complex functions (formula 6):

5. If , then 
6. y = x 3 – 3x 2 + 5x+ 2. Let's find y "(–1).
y " = 3x 2 – 6x+ 5. Therefore, y "(–1) = 14.
7. If y= log x cos x, That y" = (ln x)"cos x+ln x(cos x) " =1/x∙cos x–ln x sin x.
Let a function be given. To study it you need:
1) Find its domain of definition. If it's not too difficult, it's useful to find the range as well. (However, in many cases, the question of finding is postponed until the extrema of the function are found.)
2) Find out the general properties of the function that will help in determining its behavior: whether the function is even or odd, whether it is periodic.
3) Find out how the function behaves when the argument approaches the boundary points of the domain of definition, if there are such boundary points. If a function has discontinuity points, then these points should also be checked for the presence of vertical asymptotes of the function. Find oblique asymptotes.
4) Find the intersection points of the graph with the coordinate axes, which consists of simply calculating the value of the function under the condition:
With OX axis: y=0;
With OY axis: x=0.
Finding the points of intersection with the axis may lead to the need to solve a complex algebraic equation, which, perhaps, can only be done approximately. Having found the roots of the function and the discontinuity points, we can determine the sign of the function at each of the intervals between these points. This can be done either by calculating the value of the function at any point in the interval, or by using the interval method.
5) Find intervals of monotonicity. To do this, find the derivative and solve the inequality:
https://pandia.ru/text/78/405/images/image089.png" width="49" height="19 src=">, the function is decreasing.
Having found the intervals of monotonicity, we can immediately determine the points of local extremum: where an increase is replaced by a decrease, local maxima are located, and where a decrease is replaced by an increase, local minima are located.
6) Finding the intervals of convexity and concavity is carried out using the second derivative..png" width="39" height="19 src="> on the intervals:
if https://pandia.ru/text/78/405/images/image090.png" width="39" height="19 src=">‹0, then the function graph curve is convex.
At the same time, we define inflection points as those points at which the function changes the direction of convexity (and is continuous).
7) Finding the points of intersection of the graph with the asymptote and additional points. This point is not mandatory, but finding such points makes the study of the function and its graph complete and complete.
Note that it is useful to immediately plot the points on the coordinate axes and on the graph that are obtained during the study of functions on the drawing. This helps to understand the appearance of the graph along the way.
3. Do it yourself:
|
option | Find the derivative of the function y: |
option | Find the derivative of the function y: |
1.y=6- | 1. y=-6- 5.y= |
||
1. y=-7-1 | 1. y=-7-1 |
||
1.y=4x-3tgx+6x-8 | 1.y=-5x+2ctgx+3x-2 |
||
Practical lesson
Subject: Finding derivatives. Application of the derivative to the study of functions and plotting graphs.
Target: Master the calculation of derivatives, learn to explore a function using the derivative
Means of education: notebooks for practical exercises, presentations on the topic, Internet resources.
1. Consider theoretical material on the topics: “Rules for calculating derivatives”, “Extremum of a function”, “Convexity, concavity. Inflection point."
2. Review samples of assignments.
3. Complete test task No. 1.
Control questions:
1. Define the maximum (minimum) of a function at a point. What can be said about the sign of the increment of the function in a fairly small neighborhood of the maximum (minimum) point?
2. What are the necessary conditions for the existence of an extremum of a function? What is their geometric meaning?
3. What is the rule for finding the largest and smallest values of a function on a segment?
4. Define convexity (concavity) of a curve on an interval.
5. What is the rule for finding the intervals of convexity and concavity of a curve?
6. Inflection point of the curve. How to find her?
7. What is the algorithm for constructing a graph of a function?
Rules for calculating derivatives
Derivative of a complex function.
If at=ƒ( And), u=φ(x), then at¢ ( X)=ƒ¢ (i)·φ¢ (X).
Derivative of a sum.
If at(X)=And(X)+v (X), That at¢ (X)=And¢ (X)+v ¢ (X)
Derivative of the product.
If y(x)=u(X)· v (X), That at¢ = And¢ · v + u · v ¢ .
In particular, ( With· And)¢ =c· And¢, i.e. the constant factor is taken out from under the derivative sign. It is easy to verify that
(u 2 ) ¢ = 2 u·u ¢ , (u 3 ) ¢ =3u 2 u ¢ , … , (u n ) ¢ =n·u n–1 u ¢ .
Derivative of the quotient.
If , then  .
.
Derivatives table
1. (With)¢ =0
For a complex function: if u=u(x), That:
2. (X)¢ =1
3. (X α )¢ = α · Xα–1, A– any real number.
 .
.
3. 
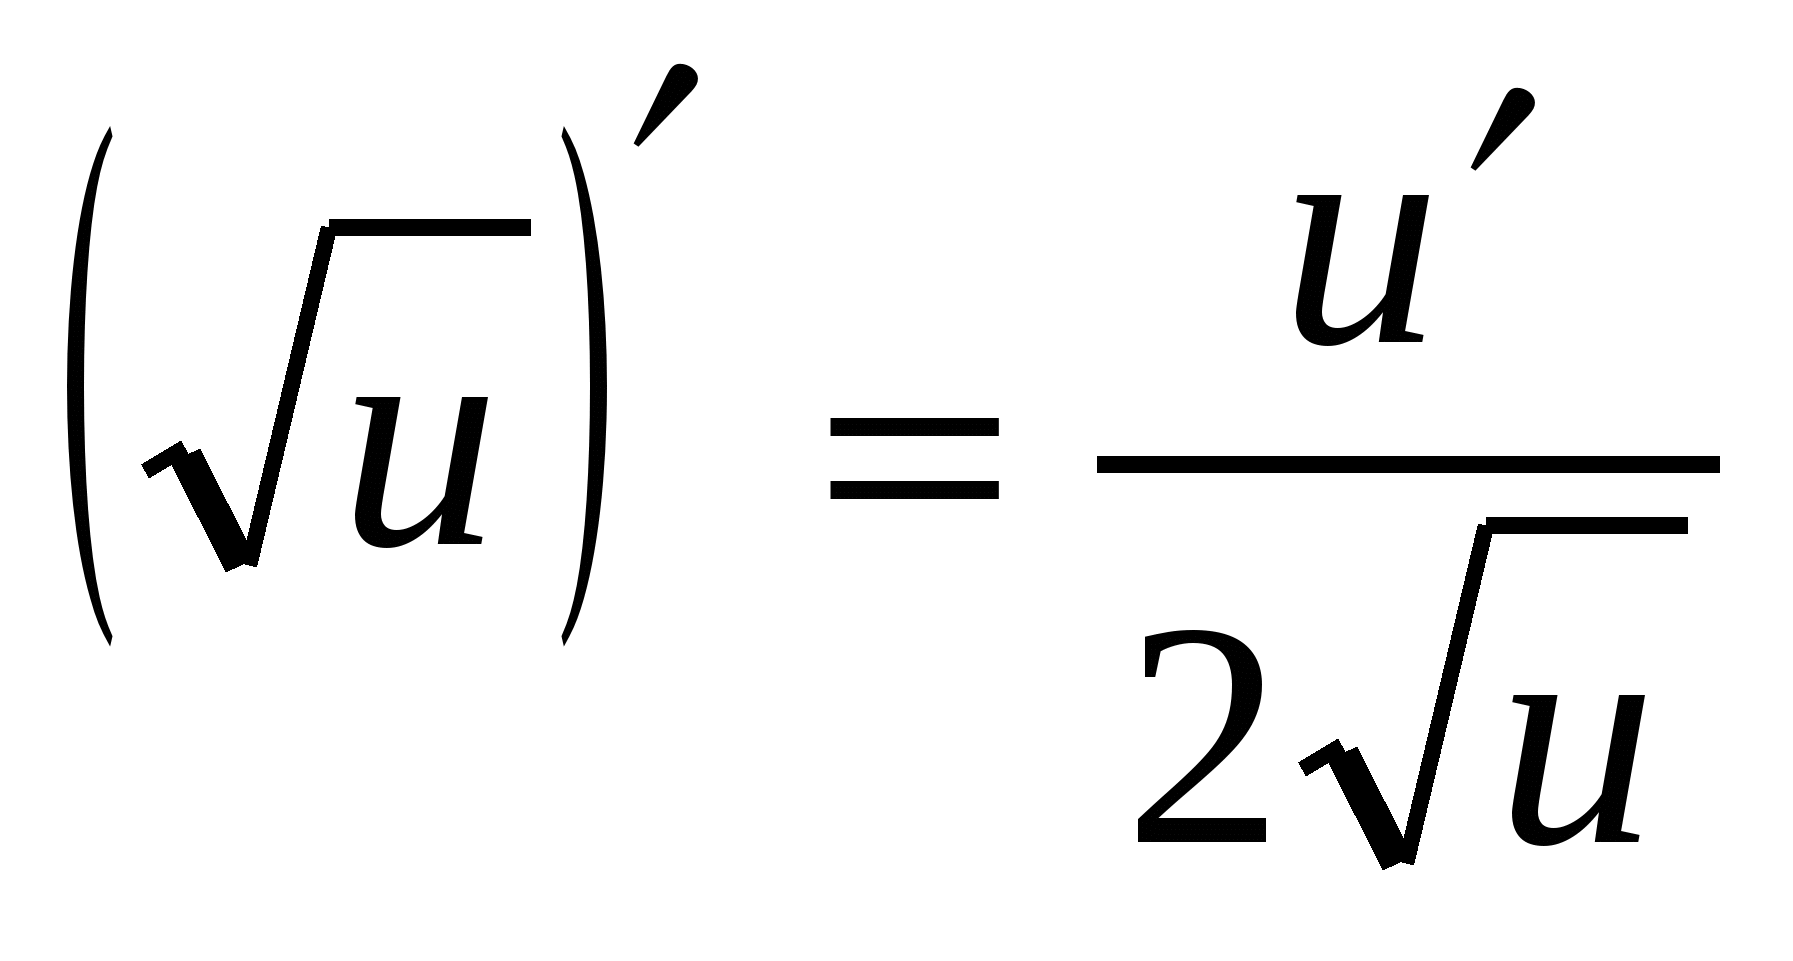
4. (A X ) ¢ =a X · ln A
4. 
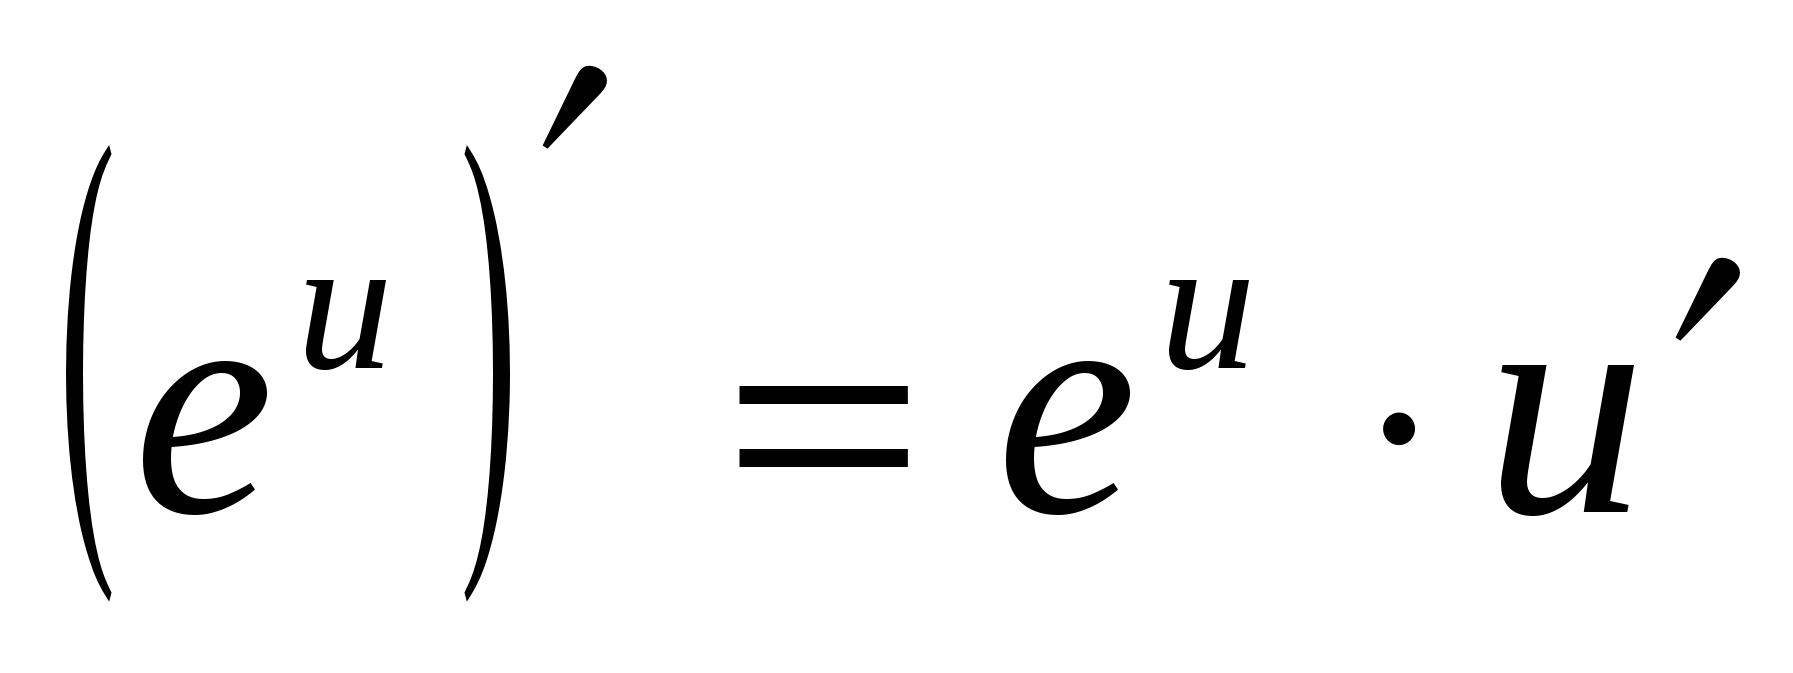
5. (log
a
x)
¢
=
 .
.
5. 

6. (sin x)¢ =cos x
6. 
7. (cos x)¢ = –sin x
7. 
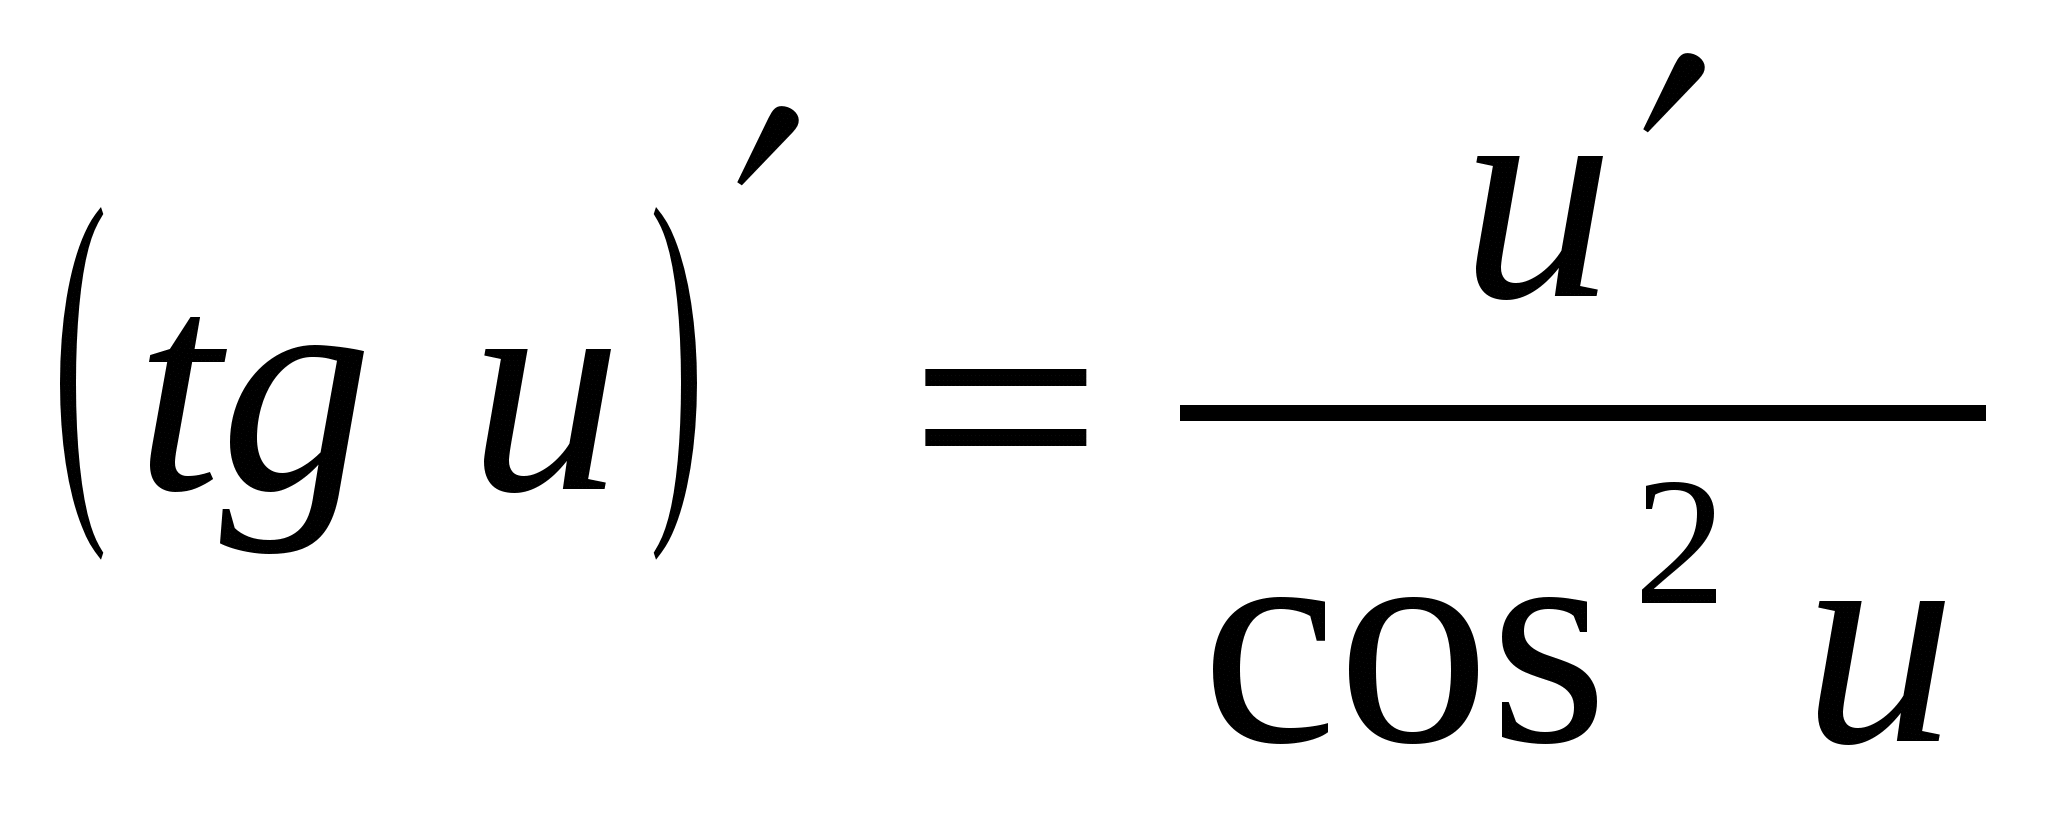
8. (tg x)¢
=
8. 
9. (ctg x)¢
=
9. 
10. 
10. 
11. 
11. 
12. 
12. 
13. 
13. 
Review Examples
Example 1.
y=(3–2 sin 5x ) 4 | We apply derivative formulas for And α ,sin u |
y ¢ =4·(3–2·sin5x) 3·(3–2sin5x) ¢ =4·(3–2·sin5x) 3 ·(0–2·cos5x·5) = –40·(3–2·sin5x) 3 .
Example 2.
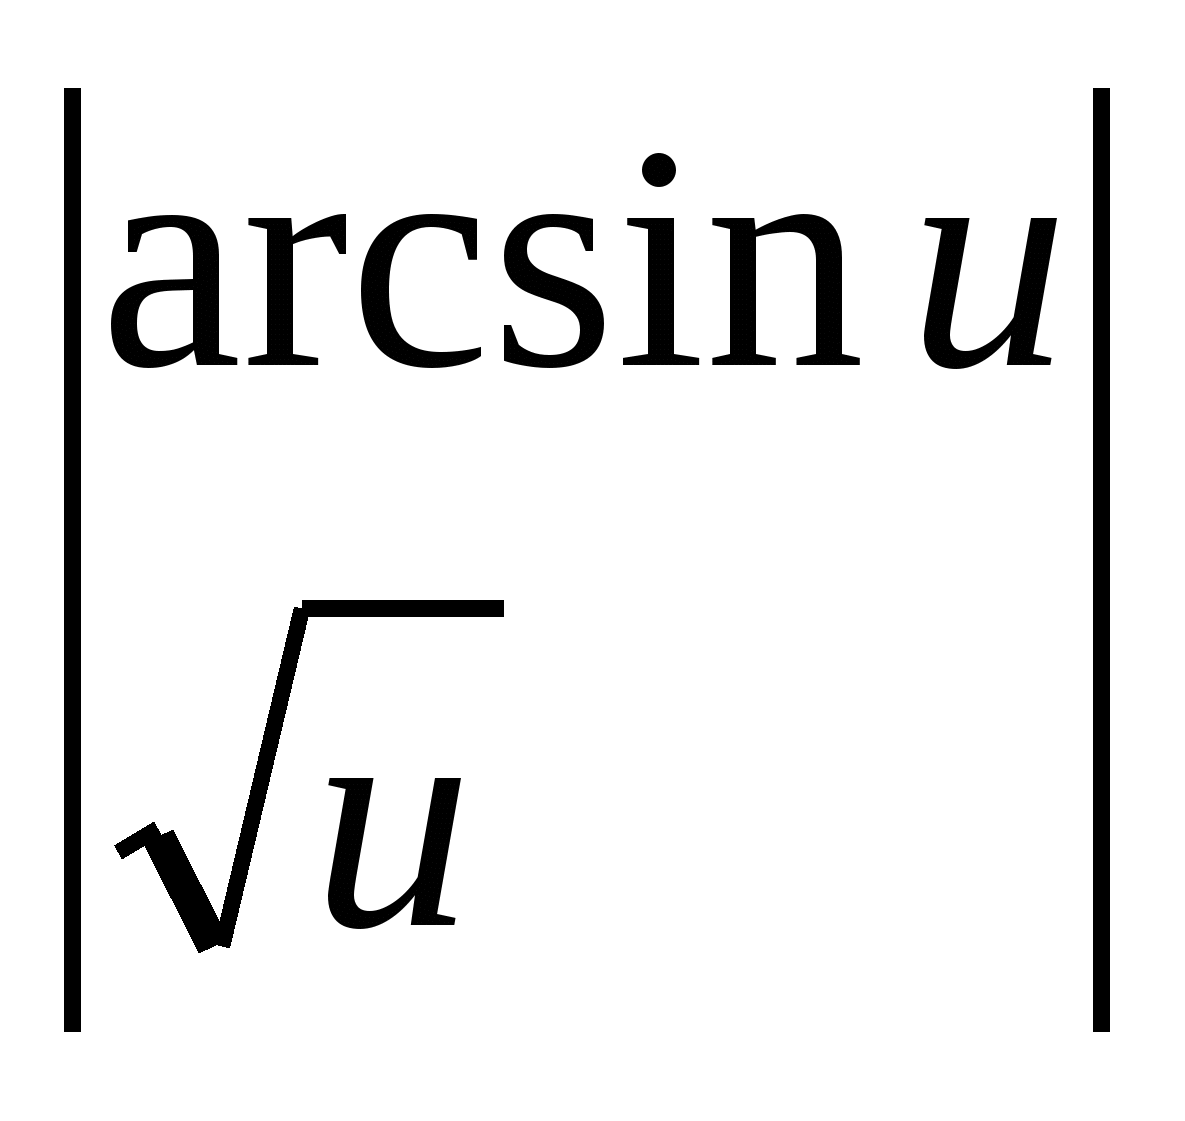
. 

Example 3.
 .
. 

Example 4.


Example 5.
 .
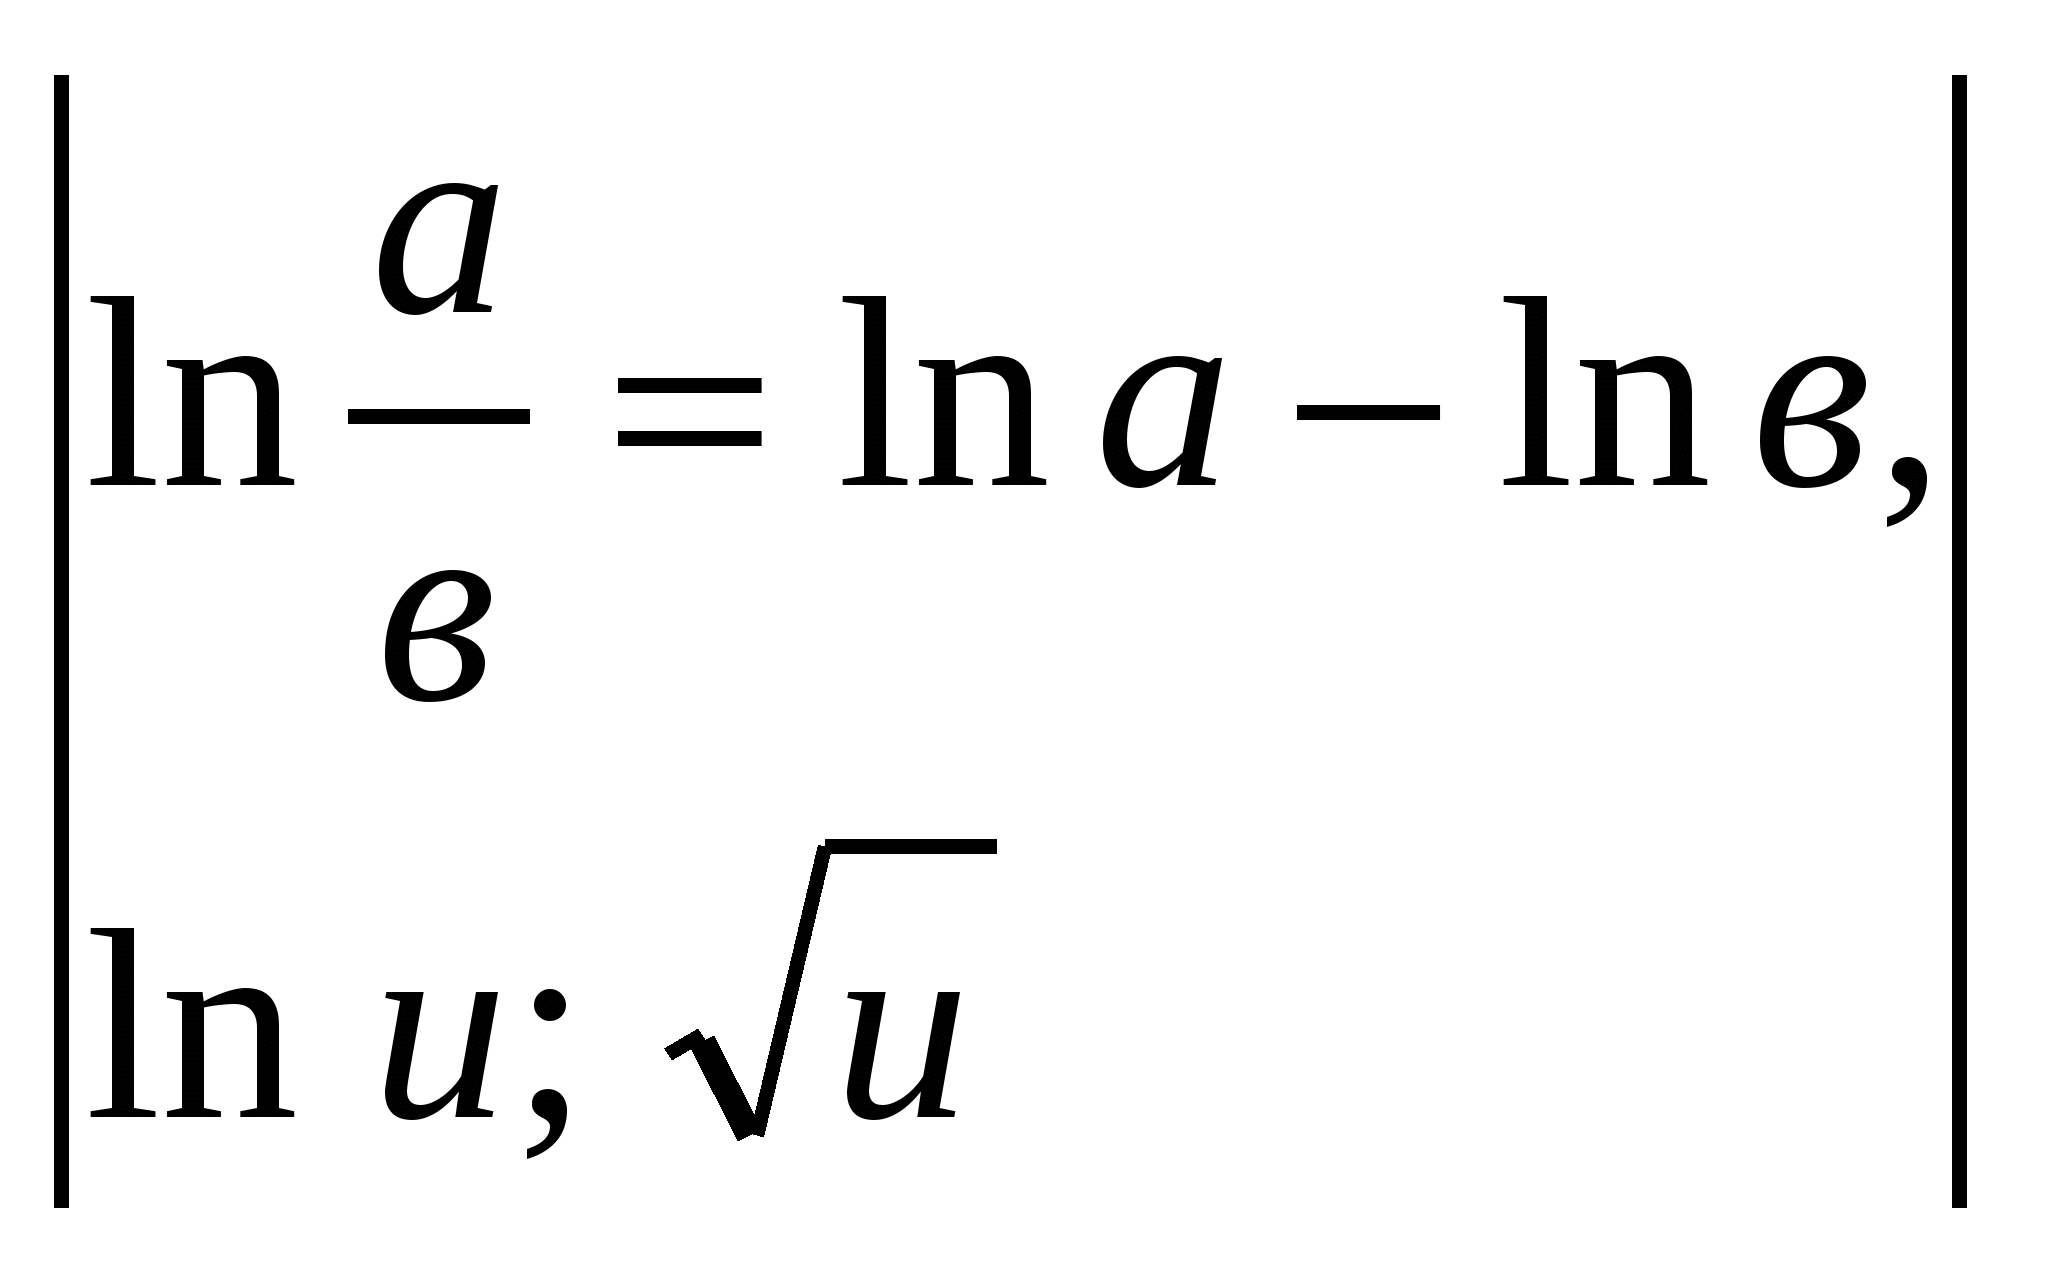
. 

Extremum of the function
The study of a function at an extremum is one of the most important applications of derivatives. Let's look at the definition of minima and maxima, and how to find them.
Let the function ƒ( X) is defined and differentiable on a certain set and a point X 0 is a point inside it.
Definition. Function ƒ (X) at point X 0 has maximum(minimum), if there is such a neighborhood of the point X 0, which is for everyone X from this area ƒ (X) < ƒ (X 0 ) (ƒ (X) > ƒ (X 0 )).
Dot X 0 is then called a point maximum(minimum).

Rice. 1.
Shown is a graph of a function that has two maximum points ( X 1 and X 3) and two minimum points ( X 2 and X 4), and the maximum value may be less than the minimum ( ƒ (X 1 ) < ƒ (X 4)). This emphasizes the fact that we characterize the singularity of a function only near a certain point.
The values of the function at the points of maximum and minimum are called extreme values or extremes. The above graph shows that the extremum points ( X 1 , X 2 , X 3 , X 4) determine the intervals of monotonicity of the function, in each of which the derivative retains a certain sign. At extremum points, of course, the derivative goes to zero. Let us formulate a theorem about necessary condition existence of an extremum.
Theorem. If the function ƒ (X) at point X 0 has an extremum, then the derivative of the function at this point is equal to zero, i.e. ƒ¢ ( X 0)=0.
Let us immediately note that this condition is not sufficient, i.e. the converse statement is not always true. From equality ƒ ¢ ( X 0)= 0 does not necessarily mean that at the point X 0 there is an extremum.
This is confirmed by an example with the function ƒ (X)=x 3 .
We'll find ƒ ¢ ( X)= 3X 2 . At the point X=0 ƒ ¢ (0)=0 . But as close to the point as you like X=0 we will find X> 0, where ƒ (X)=x 3 > 0, we'll find X< 0, где ¦ (X)=X 3 < 0. Т. е. не существует какая-либо малая окрестность точки X=0, where for all X function value at a point X=0 will be the largest or smallest. Therefore point X=0 is not an extremum point.
One can argue differently. Since the derivative ƒ ¢ (x)=3x 2 , then the function ƒ(x)=x 3 increases for any real x and has no extrema.
Points at which the necessary extremum condition is satisfied (ƒ ¢ (x)=0) are called critical .
Obviously, the tangent to the graph of the function at the points where ƒ ¢ (x)=0, parallel to the x-axis Ox .
Sufficient condition extremum is given in the following theorems.
Theorem 1. If X 0 is the critical point of the function and when passing through it the derivative changes sign, then X 0 is an extremum point, namely, if the derivative changes sign from plus to minus, it is a maximum point, and if it changes sign from minus to plus, it is a minimum point.
Note that there is no extremum at a point if the derivative does not change sign. The rule for studying extremum using the first derivative is known from the school course. It is sometimes more convenient to formulate a sufficient condition for an extremum using the second derivative.
Let the function ƒ( X) is twice differentiable in some domain (i.e. ƒ( X) has ƒ¢ ( X) And ƒ ¢¢ ( X)).
Theorem 2. If X 0 – critical point of the function ƒ(x) and ƒ ¢¢ (X 0 ) > 0 , That X 0 – minimum point, if ƒ ¢¢ (X 0 ) < 0, то X 0 – maximum point.
Using the second derivative, the convexity or concavity of the graph of a function is determined.
Convexity, concavity. Inflection point.
Curve y=ƒ(X) is called convexlyth below any of her tangent
ƒ ¢¢ ( X) < 0.
Curve y=ƒ(X) is called concave on an interval if all points of the curve lie higher any of her tangent on this interval. Then on this interval
ƒ ¢¢(x) > 0
Definition. Inflection point A curve is a point where on one side the curve is convex and on the other it is concave.
At the inflection point ƒ ¢¢ ( X)=0.
So, the sign of the second derivative (as well as the sign of the function itself and its first derivative) indicates the features of the function graph. Let's look at them again.
If for everyone X on the interval ( A, b) ƒ (X) > 0 (ƒ (X) < 0), then the graph lies above (below) the x-axis.
If for everyone X on the interval ( A, b) ƒ ¢ ( X) > 0 (ƒ ¢ ( X) < 0), то функция на (A, b) increases (decreases).
If for everyone X on the interval ( A, b) ƒ ¢¢ ( X) > 0 (ƒ ¢¢ ( X) < 0), то график на (A, b) concave (convex).
Equation ƒ( X)=0 defines the “zeros” of the function, i.e. the points of intersection of the graph with the Ox axis.
The equation ƒ ¢ ( X)=0 defines critical points.
The equation ƒ ¢¢ ( X)=0 defines possible inflection points.
Function study scheme
To study the function ƒ (X) and plotting y=ƒ(X) should be found:
1) the domain of definition of the function and the intersection point of the graph with the coordinate axes;
2) intervals of monotony;
3) points of extrema and function values at these points;
4) intervals of convexity and concavity of the graph;
5) inflection points of the graph;
6) construct in a Cartesian coordinate system all the obtained points (sometimes, to clarify the graph, additional points are obtained) and the graph itself.
The smallest and largest values of a function on a segment
When solving some problems of the optimization method, it is important to be able to find the smallest or largest values of a function on a certain segment. The function reaches these values either at critical points or at the ends of the segment.
Search scheme the smallest and largest values of the function ƒ (X) on the segment [ A, b].
1. Find the derivative of the function ƒ ¢ ( X).
2. Find the critical points from the equation ƒ ¢ ( X)=0.
3. Select those critical points that belong to this segment [ A, b] and find the value of the function ƒ (X) at each such point.
4. Calculate function values ƒ (X) at the ends of the segment: ƒ( A) and ƒ( b).
5. From the obtained function values, select the largest (largest) and smallest (smallest).
Example 2.
Find the largest and smallest values of a function ƒ(x)=X 3 –9x 2 +24х–10 on the segment.
1. ƒ ¢ ( X)= 3X 2 – 9·2 X 2 + 24.
2. ƒ ¢ ( X)=0, 3(X 2 –6X+8)=0, X 1 =2, X 2 =4.
3. Point x 2 =4 does not belong to the segment. Therefore, we calculate the value of the function only at the point X 1 =2
ƒ(2)=2 3 –9·2 2 +24·2–10=10.
4. Function values at the ends of the segment: ƒ(0)= –10, ƒ(3)=3 3 –9·3 2 +24·3–10, ƒ(3)=8.
5. Values obtained:
ƒ(2)=10, ƒ(0)= –10, ƒ(3)=8.
The highest value is 10 and is reached at the point X=2. The smallest is equal to –10 and is achieved at the point X=0.
Example 3.
Find the intervals of convexity and concavity and inflection points of the curve y=x+36X 2 –2X 3 –X 4 .
The domain of definition of this function is the set of all real numbers, i.e. XЄ(–∞, +∞).
Let's find the second derivative.
at¢ =1+72 X–6X 2 –4X 3 .
at¢¢ =72–12 X–12X 2 = –12(X 2 +X–6).
From Eq. at¢¢ =0 we get the abscissa of the inflection point:
–12(X 2 +X–6)=0 X 1 = –3; X 2 =2.
Let's define the sign at¢¢ on intervals
(–∞; –3), (–3; 2), (2, +∞).
X
(–∞, –3)
(–3; 2)
(2; +∞)
at¢¢
curve shape
convex
inflection
concave
inflection
convex
Let's find the ordinates of the inflection points:
at(–3)=726; M 1 (–3; 726) – inflection point
at(2)=114; M 2 (2; 114) – inflection point.
On the interval (–3; 2) the curve is concave. On the intervals (–∞; –3) and (2; +∞) – convex.
Samples of assignments
Task No. 1.
Find the breakpoints of the function and plot the graph

Function ƒ (X) is defined for all real X and is continuous on each of the indicated intervals: (–∞; –1), [–1; 0], (0, +∞). Let's explore the function ƒ (X) for continuity at points X= –1 and X=0.
To do this, we will find one-sided limits at each of these points.

Since the one-sided limits are different, then X = –1 – discontinuity point of the first kind.
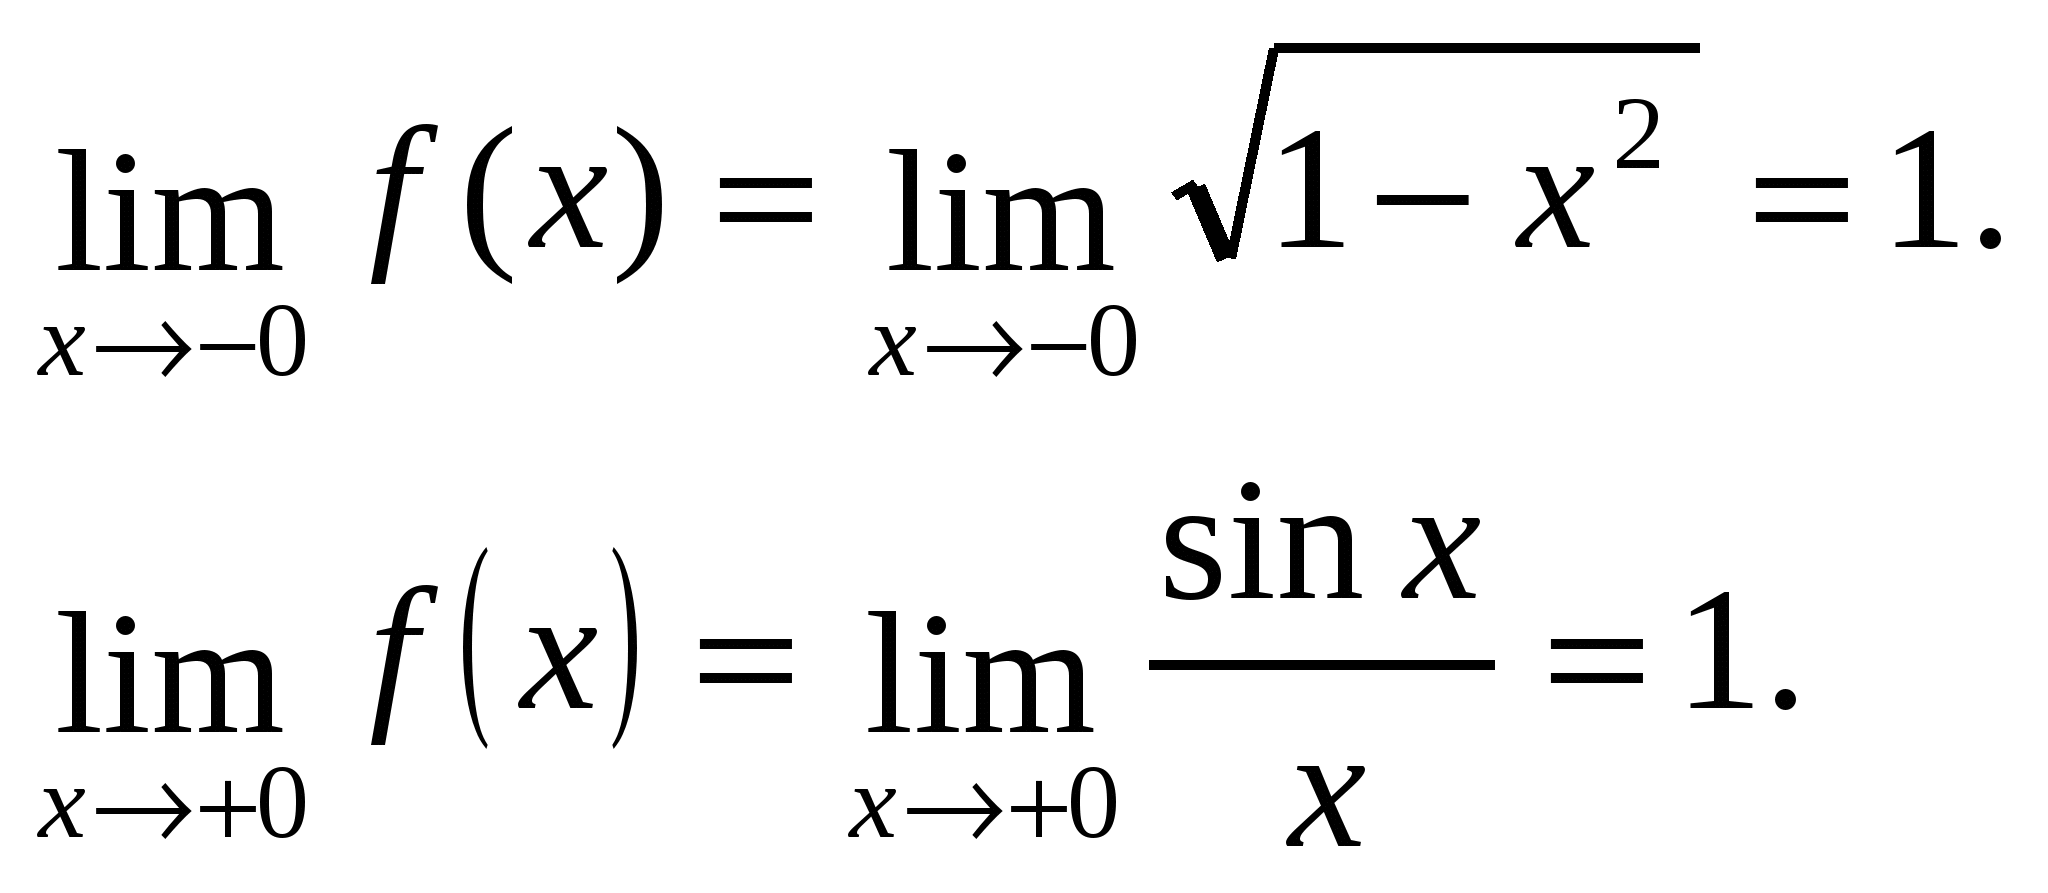
One-sided limits are equal, i.e. at the point x=0 there is a limit of the function and 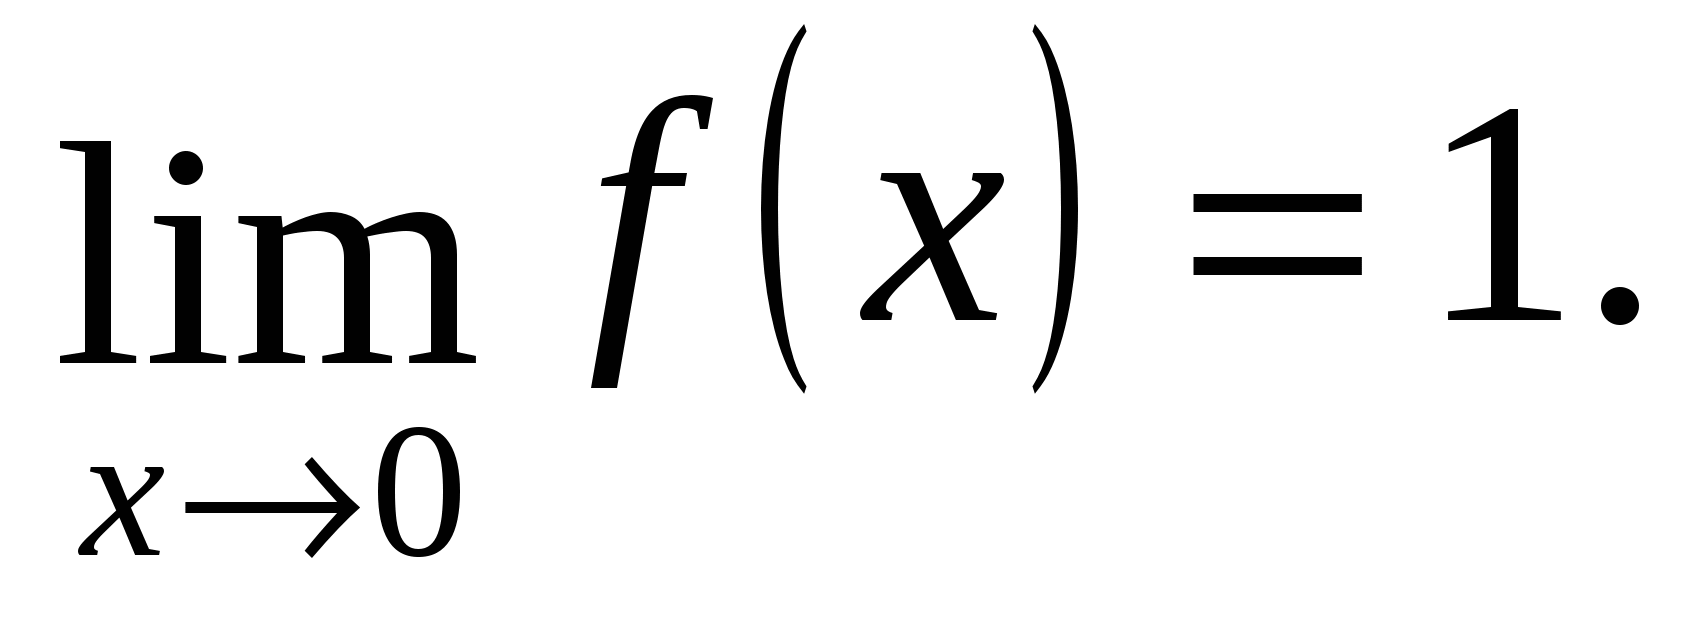
Let's compare this limit with the value of the function at the point: 
Because  then in at x=0 the function ƒ(x) is continuous.
Let's plot the function ƒ (X), given that
1)  – equation of a straight line,
2)  – equation of the upper semicircle
  with center at the origin and radius equal to unity, and under the condition –1 £ X£ 0 equation
  defines a quarter circle.
3) for X > 0 the graph is given by the equation  . We find the intersection points of this curve with the Ox axis from the equation
 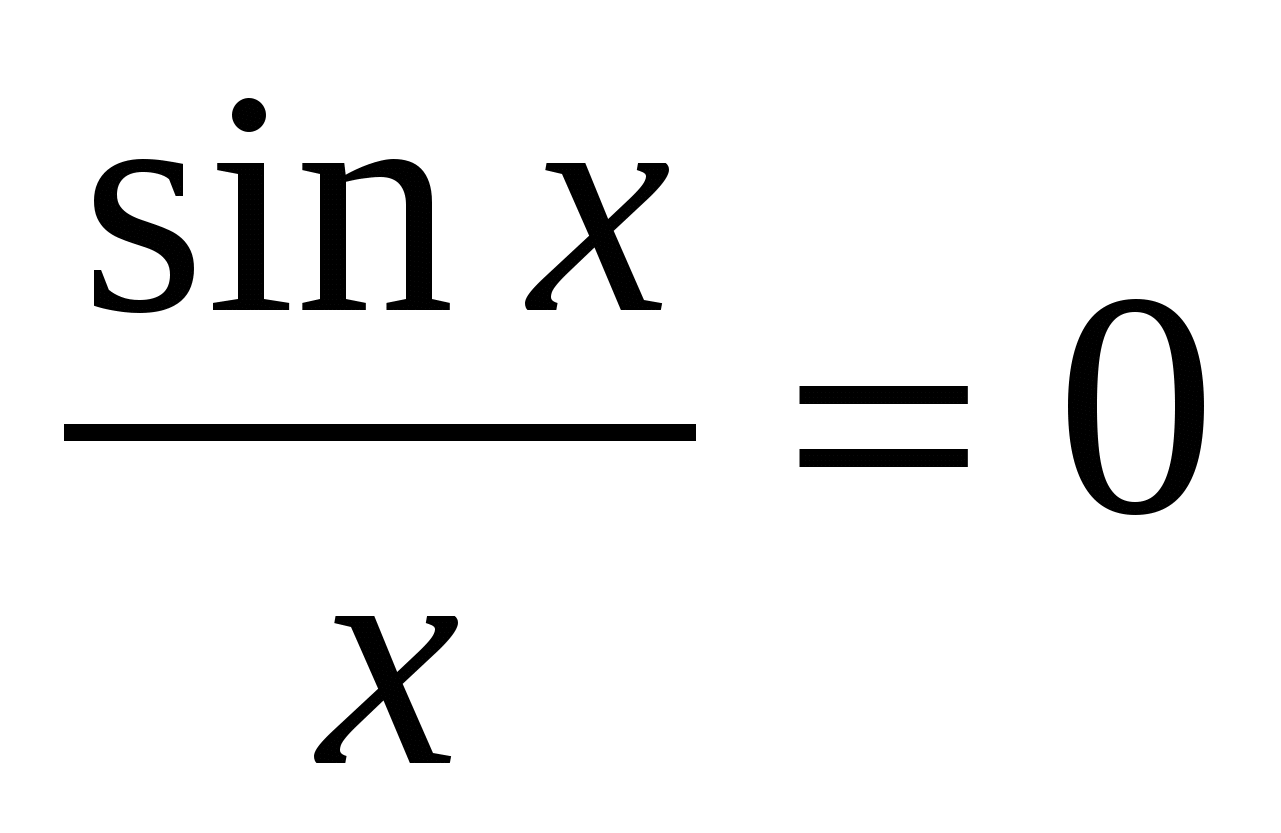 for x > 0. x= π
n, Where n
=1, 2, 3, 4,

Rice. 2.
Task No. 2.
Write equations for tangents to a line  at points where X=0 and X=4. Find the point of intersection of the tangents and the angle between them. Make a drawing.
Equation of a tangent to a line y=ƒ(x) looks like
Where at 0 =ƒ( X 0).
At the point X=0 at(0)=ƒ(0)=5.
at¢ =ƒ ¢ (X)=X–3 ƒ¢ (0)= –3.
M 1 (0, 5) has the form y– 5= –3(X–0) or
y= –3X+5.
At the point X=4 at(4)=ƒ(4)=1. ƒ¢ (4)=4–3=1.
Equation of a tangent at a point M 2 (4, 1) has the form y– 1=X–4 or
y=x–3.
We obtain the intersection point of the tangents by solving the system

Intersection point M 3 (2, –1).
Corner φ between tangents we find from the formula:
 ,
,
Where k 1 = –3; k 2 =1 – angular coefficients of tangents.
 .
.
Corner φ =arctg 2.
Let's build this line  – a parabola with a vertex at the point where X=3, because at¢
=0 at X=3. We'll find
  . Dot M 4 (3;
  ) is the vertex of the parabola.
R 
is. 3.
Task No. 3.
Explore function  and plot it.
1. This function is a polynomial (you can open the brackets, we get a polynomial of the third degree), therefore it is defined, continuous and differentiable for any X.
2. Let's find the derivative.
 .
.
From Eq. at¢ =0 let's find critical points: 3 X·( X–2)=0, X 1 =0, X 2 =2.
Let's explore them.
X
(–∞, 0)
(0; 2)
(2; +∞)
at ¢
at
3. So, the function increases on the intervals (–∞, 0) and (2, +∞), decreases on the interval (0; 2), has a maximum at x=0 and a minimum at x=2:
at max = at(0)=4; at min = at(2)=0.
4. Let's find the second derivative.
at¢¢ = 6·( X-1).
The curve is convex where at¢¢ < 0, т. е. 6·(X–1) < 0, X < 1.
The curve is concave where at¢¢ > 0, i.e. X > 1.
So, on the interval (–∞, 1) the curve is convex; and on the interval (1, +∞) it is concave.
5. We find the inflection point from the equation at¢¢ =0. Thus, X=1 – abscissa of the inflection point, because this point separates the intervals of convexity and concavity of the curve. Inflection point ordinate: at(1)=2.
Graph of a function at=(X+1)·( X–2) 2 intersects the Ox axis at at=0, i.e. when X= –1 and X=2;
crosses the Oy axis at X=0, i.e. when at=4. We got three points: (–1; 0), (2; 0), (0; 4). We will enter all the obtained points into the table, adding those adjacent to them.
–2
–1


–16


is. 4 Curve y=(x+1)(x–2) 2.
Task No. 1
We present you with tasks that may have one, two, three or more correct answers. Circle the numbers of all correct answers.
1. If  then the function
1) increasing
2) decreasing
3) constant
2. If
1) Increasing
2) Decreasing
3. If  , then the function
1) Increasing
2) Decreasing
4. If  , then the function
1) Increasing 3) Decreasing
2) Constant 4) Monotonous
5. Function  Is
Is
1) Even
2) Not even
3) neither even nor odd
4) Periodic
5) Not periodic
6) Trigonometric
7) Elementary
6. Function  Is
Is
1) even
2) odd
3) neither even nor odd
4) periodic
5) not periodic
6) trigonometric
7) elementary
2) Weierstrass 4) Dirichlet 6) Leibniz
8) Solution  Equations
1) 0 3) 0 and 3 5) 2 7) 3
2) 2 and 3 4) 2 6) -5 and 1 8) 5 and 1
9) solution to inequality 
1) ( ; 1) 3) (
 ; 1) 5) (-
 ;1)
;1)
2) (1; 5) 4) (2;  ) 6)
) 6) 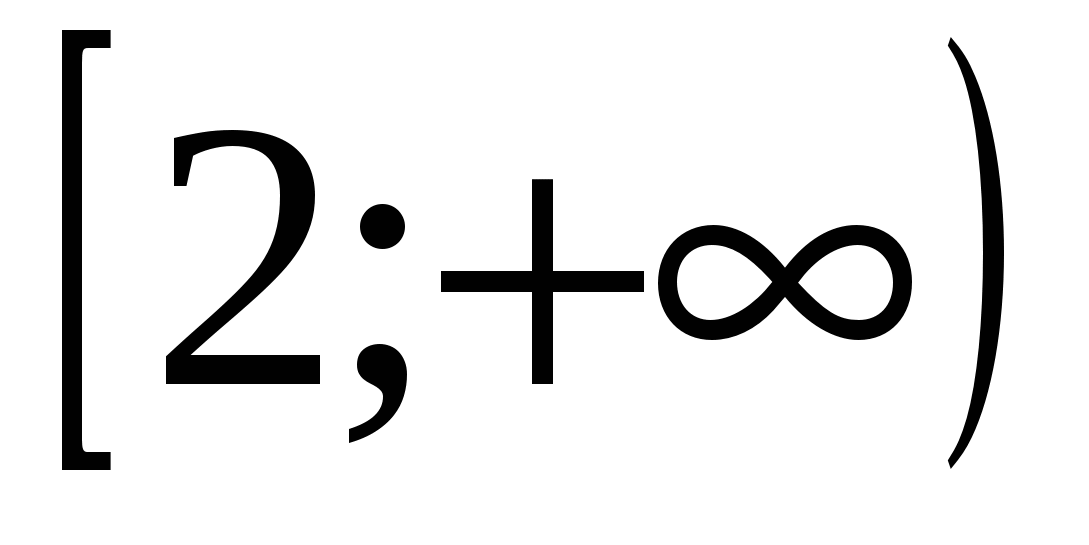
10) Method  The amount is found
1) vectors
2) straight
3) segment
11) If  , then the function
1) Concave 3) Convex 5) Decreasing
2) Monotonic 4) Increasing 6) Constant
12) the domain of definition of the function is equal to 
1) ( ;0)
;0)
2) (0;  )
)
3) (- ;
; )
)
4) (0;1)
5) 
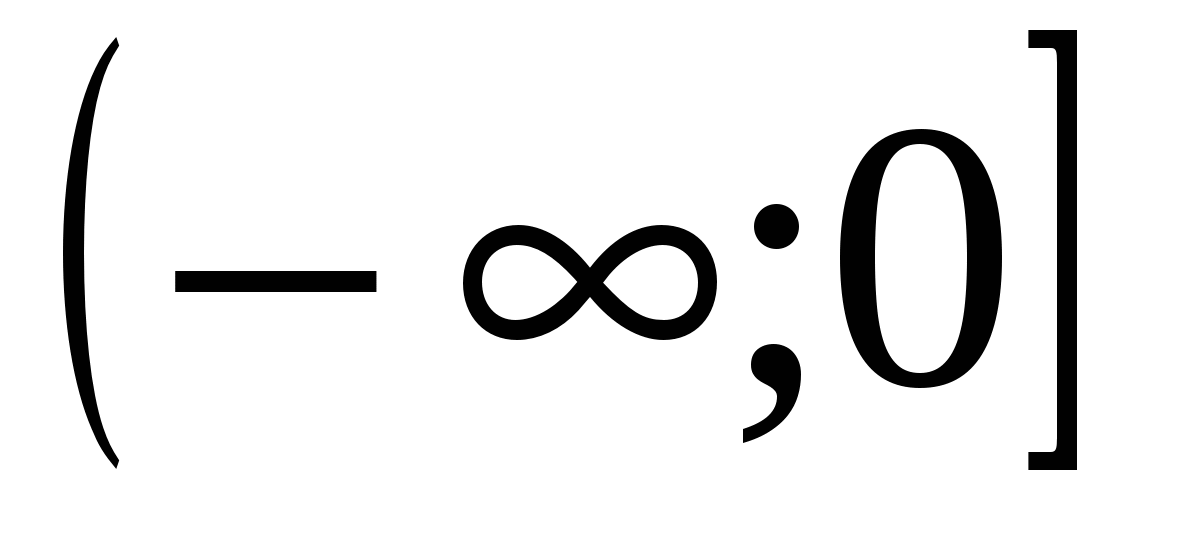
6) 
7) (-1;1)
8) 
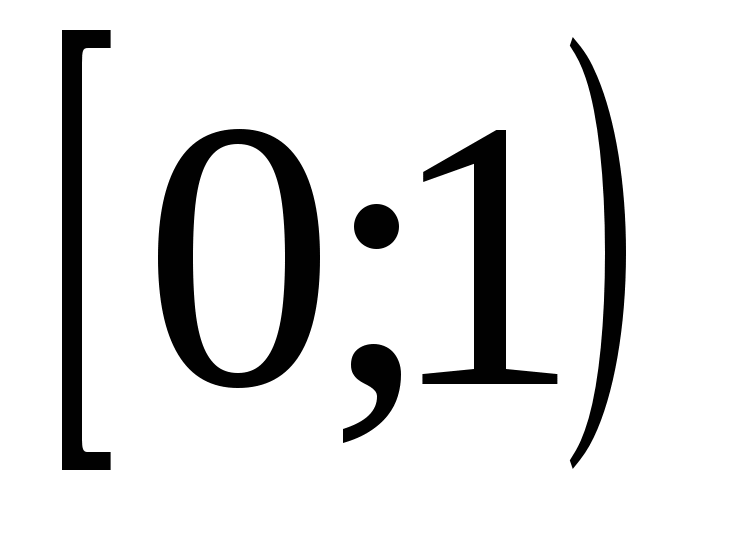
9) 
13) function  is
is
1) indicative
2) trigonometric
3) power
4) logarithmic
14) if functions y = x  then she is
1) even
2) odd
3) neither even nor odd
15) function  at
at  is
is

 .
.
